
AI Observability
See what your AI Agent does inside
Your AI Agent answers on its own, around the clock, and almost always well. What you cannot see is how much each conversation costs, which ones it ends up handing to a person and whether the model is failing silently. AI Observability opens that box, turn by turn.
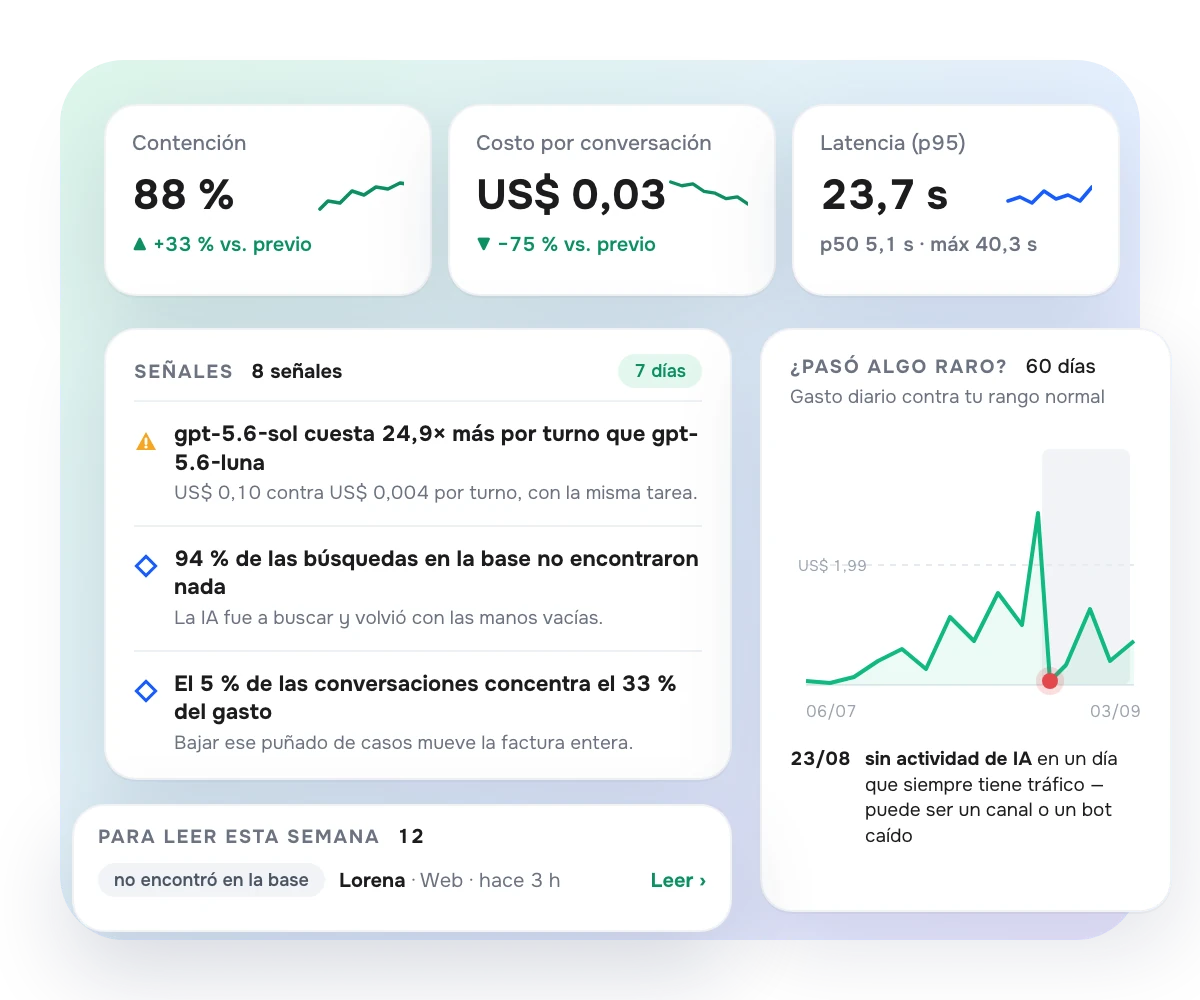
Six metrics you can click into
Every answer from your AI Agent is reconstructed: which model it used, how long it took, which tools it called, how much it cost and whether the customer was satisfied. At the top, six metrics with their change against the previous period; each one opens its daily series and its breakdown by agent, model, channel and outcome.
Containment: how many conversations the AI resolved without a human taking the chat.
Total cost and cost per conversation, with a monthly projection and cache savings already deducted.
p95 latency: the time of the slowest answers, which are the ones the customer remembers.
Token cache: how much of the prompt was reused and how much less you paid per turn.
Signals
The reading already done for you: what is expensive, what is broken, what to improve
Thirty signals go through the tables for you and write the conclusion in a single sentence, ranked by severity: a model that always fails, an agent that costs twice as much, a prompt that got bloated, containment that dropped. Click one and you do not get another summary: you jump straight to the evidence.
Inside every conversation
How the AI thought, chat by chat
In every conversation, a panel shows the agent's reasoning for that case. And the "To read this week" section builds the queue of chats worth reviewing by hand, each with its reason: it ended in an error, the customer rated it poorly, it handed off without trying, it searched the knowledge base and found nothing.
No surprises on the bill
Did something odd happen? You see it today, not in a month
Daily spend over the last 60 days against your normal range. A loop that ran away one night or a third party hammering your API shows up flagged here, along with who pushed it — not in the provider's invoice that arrives later. And errors are grouped by cause: twelve failures are usually three fixes.
metrics with their own breakdown
signals with a verdict and evidence
days of spend anomaly detection
Stop guessing what your AI is doing
Frequently Asked Questions
What do I need in order to see AI Observability?
The Generative AI add-on active and the AI Observability permission, which a Super administrator enables per user. The data appears as your agents respond.
What exactly does it measure?
Containment, AI conversations, total and per-conversation cost, p95 latency and token cache, over 7-, 30- or 90-day windows, with the change against the previous period and breakdowns by agent, model, channel, time of day, integration and knowledge base.
What are signals?
Thirty rules that read the data and write the conclusion in a single sentence: something broken, something that costs too much, something slow, something that got worse, what the customer says and what your knowledge base is missing. Every signal above its threshold is shown, and each one leads to its evidence.
Can I see why the AI answered what it answered?
Yes. Every conversation has a panel with the agent's reasoning for that chat: model, tools, documents consulted, time and cost of each turn.
Is it useful for detecting abnormal spend?
Yes. The "Did something odd happen?" section compares daily spend over the last 60 days against your normal range and flags the days that fall outside it, explaining who pushed them. You see it the same day, not on next month's invoice.