
If your contact center still measures Average Handle Time (AHT) on WhatsApp with the same formula you used for phone calls, the number on your dashboard is probably inflated between 200% and 600%. Not because your agents are slow, but because the formula was designed for a voice conversation that starts and ends in a single continuous session.
WhatsApp doesn't work like that. The customer asks at 10:14, goes to lunch, comes back at 13:42, sends another photo, leaves the chat, replies the next day. For your platform, that ticket stayed "open" for 26 hours. For your agent, it was six minutes of actual work spread across four interventions. The AHT shown on the monitor says 26 hours. That's the classic formula applied to an async channel — and it's misleading.
This article covers how AHT should be measured on WhatsApp in 2026, what real benchmarks to expect by industry, why AHT as an isolated number is a vanity metric, and which KPI quartet gives you an honest picture. Public data cited, product examples, and a final section on where the metric is heading.
The formula the industry has used for 40 years (and why it breaks on WhatsApp)
The classic Average Handle Time formula gained popularity in the 80s with the first ACD telephony systems. Its canonical form, which legacy contact center platforms still repeat, is:
AHT = Talk Time + Hold Time + After Call Work
That is: the time the agent talks to the customer, plus the time the customer is on hold while the agent looks up information, plus the post-call wrap-up time to type notes and close the ticket. Divided by the total number of calls handled.
That formula has three implicit assumptions that hold for voice but not for WhatsApp:
- The customer is available throughout the conversation. On a phone call, if the customer leaves, the call drops. On WhatsApp, the customer can vanish for 4 hours and come back as if nothing happened.
- The agent works exclusively on that interaction while it's active. On voice, an agent handles one call at a time. On messaging, a good agent runs 5 to 10 conversations in parallel.
- There's a clear closing event. On voice, "hanging up" closes the ticket. On WhatsApp, the ticket stays open until someone (agent or system) explicitly closes it — and often it's closed well after actual attention ended.
When you apply the classic formula to an async channel, the numerator (total ticket time) gets inflated with periods when no one is attending anything: the customer is having dinner, sleeping, or working on something else. Average AHT ends up measuring customer behavior more than agent performance.
That's exactly what's happening today in most attention platforms. The formula you'll find in the documentation of legacy contact center platforms is the same: (talk + hold + ACW) / total calls. When those platforms receive WhatsApp volume, they adapt it to (total handle time / total chats) — but "total handle time" is still calculated as archived - created, without discounting the hours the customer was absent.
Legacy contact center platforms inherit a voice bias and drag it into messaging. The output number looks tidy, but means nothing operationally.
The quartet: why AHT alone is a vanity metric
The right exit isn't to look for a better AHT formula. It's to stop looking at AHT as a single metric.
On WhatsApp, an honest measurement of your contact center performance needs four combined KPIs:
- FRT (First Response Time) — How long your team takes to send the first message to the customer. It defines the first impression.
- AHT (Average Handle Time) — How long the ticket stayed open, from creation to close. Useful to detect zombie tickets and queue load, not to evaluate agents.
- Service Level (SL) — Percentage of tickets answered within a target time (for example, 80% under 60 seconds). It's the actual SLA metric with your customer.
- ATA (Average Time to Abandonment) — How long customers waited before leaving without being attended. Measures pressure on your queue.
Each tells part of the story. Looking at only one leads to wrong decisions:
- High AHT without context → you pressure agents holding correct tickets that have just been waiting for the customer to reply for days.
- Low FRT without SL → you might be replying fast to the easiest 20% while the other 80% gets stuck.
- High SL without FRT → you hit the target on 80% of cases but the medians distribute poorly.
- Low ATA without AHT → you respond fast but conversations drag on after.
The real differentiator of a good contact center monitor in 2026 isn't the AHT formula it uses. It's that it shows all four KPIs simultaneously, with configurable thresholds by channel and department, and lets the supervisor see which of the four is red before making a decision.
An illustrative case of the quartet in action
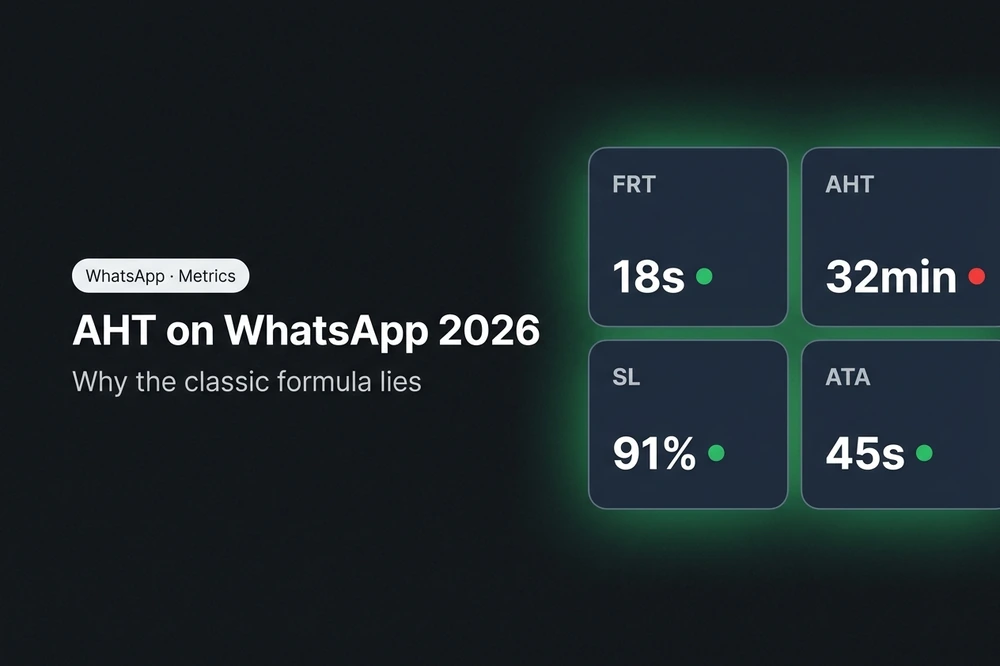
To see why AHT alone is insufficient, imagine a Latin American fintech with 40 agents handling collections on WhatsApp. The supervisor opens the monitor at 14:30 and sees this:
| KPI | Value | Status |
|---|---|---|
| Average FRT | 18 seconds | 🟢 green |
| Service Level | 91% under 30s | 🟢 green |
| ATA | 45 seconds | 🟢 green |
| Average AHT | 32 minutes | 🔴 red |
Looking only at AHT, the supervisor concludes there's a serious problem and starts pressuring the team: asks agents to close tickets faster, considers hiring more people, flags this as a crisis in the weekly report.
When they add the other three KPIs to the analysis, the conclusion changes: FRT, SL and ATA are all green. That means agents respond fast, meet the SLA with the customer, and no one is abandoning the queue out of neglect. The high AHT isn't from the team.
When they break down AHT by components (something that requires looking at individual message timestamps), they discover that 70% of those 32 minutes is customer idle time: the debtor receives the agent's message, goes to confirm with their partner whether they can pay, comes back 20 minutes later with the answer. Real active AHT: 9 to 10 minutes, perfectly normal for collections.
The problem wasn't operational. It was a misleading metric. Without the quartet, that supervisor would have made wrong decisions — pressuring agents who were doing their job well, hiring to solve a non-existent problem, generating turnover. That's the difference between measuring well and measuring numbers.
Real industry benchmarks on WhatsApp
Unlike voice benchmarks (reasonably consolidated after decades of measurement), WhatsApp benchmarks are still forming. The most solid public data comes from Raion Tech and Aurora Inbox for 2025-2026, complemented with ranges observed in contact center operations in LATAM markets.
This table summarizes what to expect by vertical. The FRT and SL columns come from the cited sources; the active AHT and % automatable columns are typical observed ranges, not precise estimates — they serve as orders of magnitude for designing targets, not figures to cite as industry benchmarks:
| Industry | Excellent FRT | Acceptable FRT | Expected AHT | Realistic SL | % automatable |
|---|---|---|---|---|---|
| E-commerce | < 1 min | < 5 min | 3-8 min active | 85% in 60s | 70-80% |
| Fintech / collections | < 30s | < 2 min | 5-12 min active | 90% in 30s | 60-75% |
| Healthcare (appointments) | < 1 min | < 5 min | 4-9 min active | 80% in 60s | 75-85% |
| ISP / telco | < 1 min | < 5 min | 8-15 min active | 75% in 90s | 50-65% |
| Traditional retail | < 2 min | < 10 min | 4-10 min active | 75% in 2 min | 60-75% |
| B2B / services | < 5 min | < 30 min | 15-45 min active | 70% in 5 min | 30-50% |
| Tourism / hospitality | < 2 min | < 15 min | 5-15 min active | 75% in 2 min | 55-70% |
"Active AHT" means real handling time of the ticket discounting customer inactivity windows greater than 30 minutes. If your platform doesn't separate customer idle time, multiply those numbers by 2 to 5 to get the figure that will appear on your current monitor.
Three important patterns from the table:
- Verticals with lots of repetitive queries (e-commerce, healthcare, fintech) have the highest % automatable. A well-trained AI Agent solves 70-80% of order tracking, appointment scheduling or balance inquiry queries without passing to a human. That lowers human AHT because the average complexity of tickets reaching the agent goes up — but channel average AHT drops because most close automatically in seconds.
- B2B and services have the most permissive FRT but the highest AHT. B2B customers expect less initial urgency but deeper conversations. Applying e-commerce benchmarks to B2B is one of the most common mistakes.
- LATAM has stricter FRT expectations than the global benchmark. 78% of Latin American consumers buy from the first business that responds to them. An FRT > 5 minutes reduces conversion probability by 65%.
The trade-off no one quantifies: low AHT vs high CSAT
The obsession with lowering AHT is one of the most common traps in contact centers in 2026. The intuitive logic is: if we lower AHT, we handle more tickets with the same agents, cost per contact drops. But the public data tells a different story.
SQM Group documented a 1:1 correlation between First Call Resolution and CSAT: every point of FCR improvement moves customer satisfaction by one point. And FCR collapses when you push AHT below a certain threshold, because agents start closing tickets without resolving the actual problem, or redirect to another channel just to get rid of the ticket. The customer comes back the next day with the same problem, opens another ticket, and average AHT appears to improve while the experience deteriorates.
McKinsey measured the inverse effect on contact centers that implemented GenAI well: 9% AHT reduction combined with a 14% increase in issue resolution per hour. The key is that AHT dropped because the agent had the right information first (via copilot suggesting responses and searching the knowledge base), not because they were pressured to dispatch faster.
The operational rule that follows is clear: lowering AHT is good only if it doesn't degrade FCR, CSAT and NPS at the same time. Forcing it with scripts and agent pressure destroys all three. Doing it with well-integrated AI improves all three.
A case that illustrates how to automate badly and ruin the experience: the Klarna episode with AI in customer service — they lowered AHT and cost per contact in the short term, but ended up backtracking on CSAT and re-internalizing human support. The lesson wasn't "don't use AI"; it was "don't use AI without measuring quality alongside efficiency."
5 real levers to lower AHT on WhatsApp (without breaking quality)
These are the five levers with the most documented impact in 2026, ordered by typical return:
1. AI Agent that solves the 60-80% automatable from the entry point
The lever with the biggest impact on AHT isn't lowering the human agent's time: it's taking out of the human queue everything that doesn't need a human. An AI Agent with RAG over your knowledge base handles tracking queries, scheduling, FAQs, data validation and routing without touching the human team. Gartner predicts that by 2029, 80% of common queries will be resolved by agentic AI without human intervention.
Typical impact on channel AHT: -40% to -60%, because short automated tickets close in seconds and dramatically lower the average.
2. Copilot that assists the human agent on every response
For tickets that do require a human, an AI copilot suggests responses, searches the knowledge base, completes CRM information and proposes next steps in real time. McKinsey measured 9% AHT reduced + 14% issue resolution per hour gained in agent assist deployments.
Typical impact on human AHT: -15% to -30%, maintaining or improving CSAT.
3. Dynamic templates and pre-approved responses
A good library of templates with dynamic variables (customer name, last order, next appointment) covers 40-60% of frequent responses. The agent picks a template, tweaks a line, sends. Also vital to avoid WhatsApp template rejections by Meta.
Typical impact: -10% to -20% human AHT, with a consistent quality floor across agents.
4. Routing by intent and skill matching
That a customer with a technical issue doesn't fall into the sales queue. That a VIP customer doesn't wait the same as a walk-in. An AI Agent can classify intent and route to the right agent or department in seconds, lowering internal handoffs between areas which is one of the main AHT inflators.
Typical impact: -10% to -25% AHT, mostly from reduced transfers.
5. Self-service: scheduling, payments, collections, FAQs
For cases where the customer doesn't need to converse but to complete an action, conversational self-service resolves without a human and without a conversational AI agent. Book an appointment, pay a balance, check a shipment, download an invoice. A conversation closes in 30 seconds without going through the team.
Typical impact: depends on the automatable volume of each vertical, but in e-commerce and healthcare it can absorb 50-70% of total volume.
A lever almost no one mentions: managing Meta's 24h window
WhatsApp Business API has an operational rule that changes the entire economics of the channel: if more than 24 hours pass since the customer's last message, you can no longer send a free-form message — you need a Meta-approved template, which is charged per business-initiated conversation and requires pre-approval.
The operational consequence of this is brutal and almost never measured: every time a human agent leaves a ticket "on hold" for more than 24 hours and then needs to pick it back up, your platform had to open a new paid conversation or simply couldn't continue. That inflates both AHT (because tickets stay stalled waiting for the window) and cost per contact (because business-initiated templates cost more than customer-initiated conversations).
The contrarian lever is to configure an AI Agent that proactively manages the 24h window: when a ticket has gone 18-20 hours with no customer activity, send a natural message ("did you get a chance to review what we talked about? Let me know if you need anything else") that reopens the window if the customer responds, or cleanly closes the ticket if not. That turns zombie tickets into definitive closures and lowers average AHT between 15% and 25% just by fixing end-of-conversation behavior.
Another lever in the same line: consolidating duplicate tickets from the same customer. When a customer opens three separate tickets in two hours out of confusion or impatience, automatically merging them into one (with detection by number and time proximity) lowers apparent FCR and average AHT without operational effort. These two levers, combined, move the needle more than many poorly calibrated generative AI implementations.
How AsisteClick measures it in production
The AsisteClick Contact Center monitor shows the four KPIs in real time, with a dashboard that refreshes every 5 seconds when the date range includes today.
The default thresholds (configurable by supervisor):
| KPI | 🟢 Green (ok) | 🟡 Yellow (alert) | 🔴 Red (critical) |
|---|---|---|---|
| FRT (First Response Time) | < 30 seconds | 30 to 60 seconds | > 60 seconds |
| AHT (Average Handle Time) | < 5 minutes | 5 to 10 minutes | > 10 minutes |
| Service Level | ≥ 80% answered in < 20s | 60% to 80% | < 60% |
| Unassigned chats | 0 to 2 in queue | 3 to 5 in queue | > 5 in queue |
The supervisor can adjust all thresholds by channel and department. A healthcare team handling appointments can be strict on FRT (target < 30s, high urgency) and lenient on AHT (target < 15 min, long conversations are normal). An e-commerce team can invert that logic.
Beyond the quartet, the monitor shows three parallel tables:
- Distribution by department — who's online, paused, with how many active chats and how many in queue.
- Status by agent — each agent with their individual FRT, AHT and SL, quickly identifying who's overloaded vs who has capacity.
- Board by channel — breaks down inbound, answered, abandoned, % abandonment, ATA and SL by channel (WhatsApp, web, email, etc).
That last table is key for comparing channels. In practice, WhatsApp has average FRT 225% faster than phone channels and Service Level between 10 and 20 percentage points higher, simply because the customer doesn't abandon the queue — the ticket waits.
Towards an AHT 2.0 for async channels
While the current monitor measures AHT as close - creation (the classic formula), the natural direction for 2027 is to split the metric into two components:
- Active AHT: real handling time of the ticket, discounting customer inactivity windows above a threshold (for example, 30 minutes without activity from either side).
- Total AHT: the current metric, useful for detecting zombie tickets and queue volume.
This separation will progressively become standard on platforms that take async messaging seriously. For now, the FRT + AHT + SL + ATA quartet, looked at as a combo, covers 90% of the operational decisions a supervisor needs to make.
A good health indicator for your WhatsApp contact center is this combination: low FRT (< 1 min), high Service Level (> 85% in 60s), AHT stable month over month (no upward trend), and ATA low or zero (customers don't abandon because the bot handles them while waiting for human). If all four are green, the exact mathematical AHT formula matters much less.
What this means in money
To finish grounding why measuring the quartet well matters, it's worth translating it to operational economics.
Take a typical LATAM contact center operation: 50 agents dedicated to WhatsApp support, total loaded cost (salary + benefits + supervision + infrastructure) of USD 1,000 to 1,500 per agent per month. That's between USD 600,000 and USD 900,000 per year in headcount.
If you apply the AI levers described above well — AI Agent resolving 60-80% automatable, copilot assisting the human, dynamic templates, intent routing, 24h window management — the documented range of operational reduction is 25% to 40% of human effort, maintaining or improving CSAT. It's not firing 30% of the team: it's redirecting that capacity to higher-value tickets, absorbing next year's growth without hiring more, or closing the night shift without losing coverage.
In concrete terms: a 50-agent LATAM operation can free between USD 150,000 and USD 360,000 per year in operational capacity with a well-measured AI implementation. A customer service platform with AI integrated costs a fraction of that — the documented ROI on serious deployments is consistently above 5x in the first year, and above 15x when all levers are combined.
The problem isn't whether the investment is worth it. It's measuring correctly what you're optimizing. If your only metric is AHT and the formula is broken, you'll optimize the wrong number and the investment will seem like it doesn't pay off. The quartet is what makes the investment visible.
Frequently Asked Questions
What is AHT on WhatsApp and how is it calculated?
AHT (Average Handle Time) on WhatsApp is the average time it takes to resolve a conversation, usually calculated as close time minus creation time divided by total conversations. Unlike voice AHT, on WhatsApp this formula includes customer inactivity periods, so it's best to always look at it alongside FRT, Service Level and ATA for a full picture of performance.
What's a good AHT on WhatsApp in 2026?
A good AHT on WhatsApp depends heavily on the industry, but the acceptable range of active time (discounting customer inactivity) is 3 to 15 minutes. E-commerce and healthcare sit at the low end (3-8 min); ISP, B2B and professional services at the high end (10-45 min). Much more important than the absolute number is stability month over month and the combination with CSAT and FCR.
How to lower response time on WhatsApp without destroying quality?
To lower response time on WhatsApp without affecting quality, combine an AI Agent that resolves 60-80% of frequent queries with a copilot that assists human agents on complex ones. That combination reduces AHT between 25% and 50% per McKinsey, while maintaining or improving CSAT because human agents work with better information. Avoid pressuring AHT with scripts and individual metrics without context: it destroys FCR.
Is AHT the same as First Response Time (FRT)?
No, AHT and FRT measure different things. FRT (First Response Time) measures how long your team takes to send the first message to the customer; AHT (Average Handle Time) measures the total duration of the conversation from creation to close. Both are critical metrics on WhatsApp and should be looked at together: low FRT with high AHT may indicate conversations dragging on unnecessarily, while high FRT with low AHT signals conversations closing fast but starting late.
What alert thresholds should a WhatsApp contact center dashboard have?
The recommended default thresholds for a WhatsApp contact center dashboard are: FRT green below 30 seconds and red above 60 seconds; AHT green under 5 minutes and red over 10 minutes; Service Level green with 80% or more of responses within 20 seconds. These defaults should be adjusted by channel and department according to each vertical's operational reality.
Keep reading
- How AI copilot accelerates real-time responses — lever #2 with concrete cases
- Formula to measure chatbot ROI — financial metrics that dialogue with AHT
- Klarna and the lesson of lowering AHT badly — the case not to copy